Xedge32
Xedge32 is a development environment for embedded edge devices. It combines a web-based interface with Lua-driven application development so you can build, test, and iterate directly on the target device.
Xedge itself is available on multiple platforms, but this guide focuses on the ESP32-specific workflow. For the broader Xedge feature set, see the Xedge main documentation.
Working with Example Applications
The LSP-Examples repository contains a good set of ESP32-oriented examples. A practical way to learn Xedge32 is to upload these examples, open them in the browser IDE, and run them directly on the device.
Basic workflow:
Download the ESP32 example files to your computer.
Upload them to the ESP32 using WebDAV or the built-in Web File Manager.
Create a new application from the uploaded directory.
Open the example files in the IDE and run them one by one.
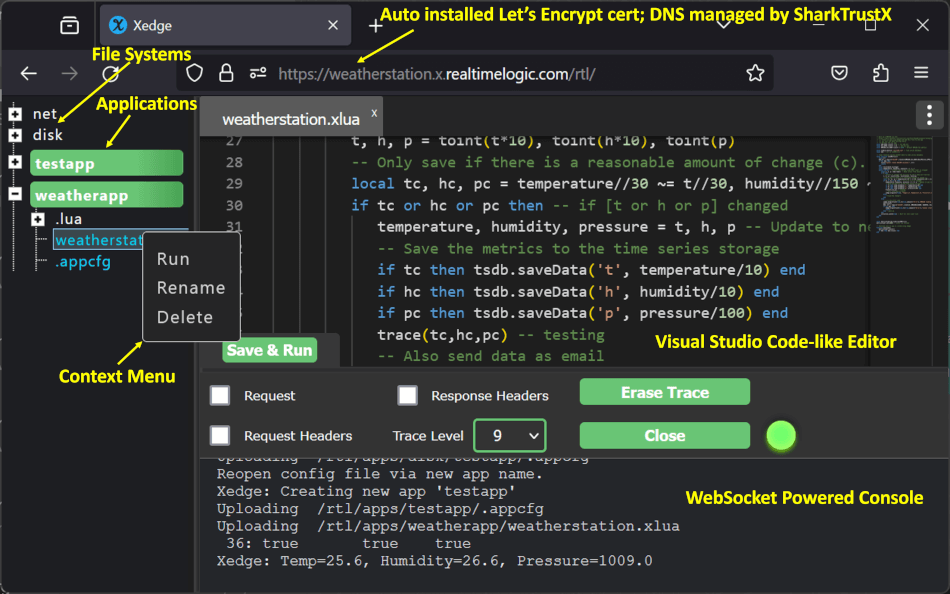
Uploading Files to the ESP32
You can use the combined WebDAV and Web File Manager endpoint at
http://ip-address/rtl/apps/.
If you want a walkthrough for mounting the device as a WebDAV drive, see the
WebDAV how-to video.
If you prefer the browser workflow:
Open
http://ip-address/rtl/apps/.Click the + button and create a directory named
Lua-Examples.Open the new directory at
http://ip-address/rtl/apps/Lua-Examples/.Drag and drop the downloaded example files into the browser window.
The upload starts as soon as you drop the files into the page.
Creating an App from the Uploaded Directory
After the files have been uploaded:
Navigate to
http://ip-address/rtl/.Expand disk in the left pane.
Right-click the
Lua-Examplesdirectory.Select New App.
Enable Running and LSP App.
Click Save.
You can now expand the example application in the left pane, open any example file in the editor, and run it directly from the IDE.
Using an External IDE
The built-in web IDE is excellent for quick iteration, but an external editor or IDE may be more comfortable for larger projects. You can edit files directly on the ESP32 by mounting the device as a WebDAV drive.
For operating-system-specific instructions, see the How to Mount a WebDAV Drive guide.
The WebDAV URL is:
https://ip-address/rtl/apps/
Debugging Lua Code
Remote debugging is supported through the Barracuda App Server Lua debug module. This workflow integrates with Visual Studio Code and lets you debug Lua running on the device.
One important detail is that breakpoints pause the server. Because of that, the device’s WebDAV service is also paused while the debugger is stopped. For this reason, it is better to keep your source files on the host computer and let the device access them through NetIo during a debug session.
For the NetIo background, see the additional Xedge documentation.
Debugging Workflow
Follow the How to Debug Lua Code Using Visual Studio Code guide and complete the prerequisites listed there.
Then:
Copy the File Server directory into
xedge-ESP32/BAS/examples/xedge/FileServeron your host machine.Start the Mako Server from
xedge-ESP32/BAS/examples/xedge:mako -l::FileServer
If
makois not in your path:/path/2/mako -l::FileServer
When the File Server opens in the browser, click
Lua-Examplesand copy the full URL shown by the file server.In Xedge32, open
http://ip-address/rtl/, right-click net, and paste that URL into the app dialog.Enable Running and LSP App, then click Save.
As soon as the device connects to the File Server app, you should see a message similar to:
Creating 'Visual Studio Code' config file: Lua-Examples/.vscode/launch.json
The generated launch.json includes the required sourceMaps attribute.
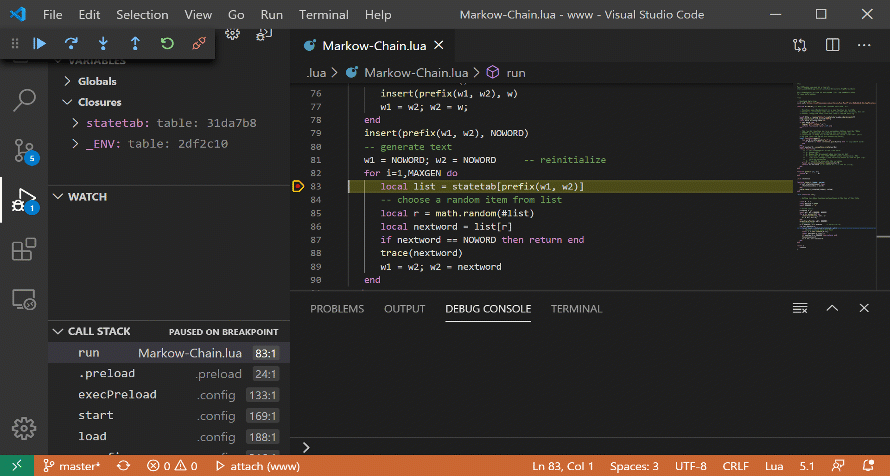
Starting the First Debug Session
Open the local directory
xedge-ESP32/BAS/examples/xedge/Lua-Examplesin Visual Studio Code.Open
httpclient.lspand add the following lines near the top of the file:require"ldbgmon".connect{client=false} trace"Running LSP page"
In a browser, open
http://ip-address/LuaExamples/httpclient.lsp.The page will appear to hang. That is expected because the web server is now waiting for the debugger to attach.
Press
F5in Visual Studio Code to start debugging.
Once the debugger attaches, execution stops automatically. You can now step through the code, resume execution, and set breakpoints for later runs.
When you refresh the page again, the new breakpoint is hit. You can even step into library code such as httpm, including Lua code embedded in the firmware image.
Further Reading
Before diving deeply into application development, it helps to read the following:
Additional articles that work well with Xedge32:
How to connect the ESP32 to an MQTT cloud server using Mutual TLS Authentication
How to design a web user interface by using a ready to use dashboard app template
How to perform rapid IoT device client development using Lua
How to access the web server behind a firewall without using port forwarding
Using the ESP32 as a foundation for your On-Premises IoT Platform